Download maps for no-signal work, filter and label your data
Download map areas by zoom for campaigns with no coverage, SQL filters over tables, and feature labelling on the map.
Download maps for no-signal work, filter and label your data
Settings and Tools Buttons
 Resource Manager: Opens the screen where you can add resources (tables, rasters, basemaps, etc.) to the map and manage them (import, export, edit attributes, etc.). (see Resource Manager).
 Measure: Activates the geometry editing mode (see Geometry Editor) where you can draw a line that works as a measuring tape and shows different measurements in the status bar, as seen in the following figure:

- **NOD X, Y and Z**: Coordinates of the selected node in the map's unit of measurement. In tables that only support XY, the Z is not shown.
- **AZ, DP, D and Dz**: Azimuth, dip, and length of the vector between the previous node and the currently selected node. If the coordinate has a Z component, Dz is the three-dimensional length of the vector, and D is the flattened length (ignoring the z values)
- **TD and TDz**: Total length of the polyline. If the coordinate has a Z component, TDz is the three-dimensional length of the polyline, and TD is the flattened length (ignoring the z values)
- **TP**: Total perimeter of the polygon resulting from closing the polyline, ignoring the Z component of its nodes if they have one.
- **TA**: Total area of the polygon resulting from closing the polyline, also ignoring the Z component.
 Undo / redo: A tap reverts the last action. Holding it down redoes, repeating if held. Both actions play characteristic sound notifications.
 Settings: Access to the general preferences. (see Preferences Window).
Offline Maps
Basemap layers get their images over the internet from WMS, WMTS, or XYZ tile services, which provide tiled maps at different zoom levels (each level has twice the resolution of the previous one). These tiles are automatically stored in internal memory for 30 days and can be viewed offline during that period. It is also possible to download the data for the visible area using the offline maps manager.
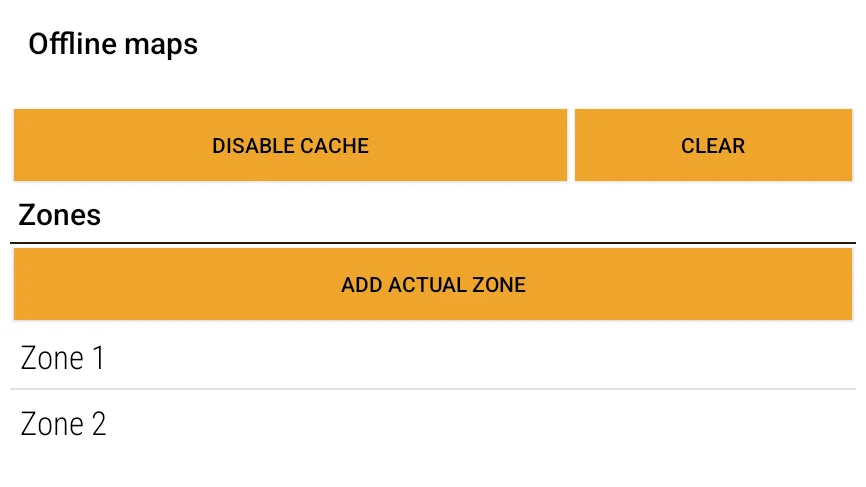
In this window, you can enable or disable the automatic 30-day cache, as well as clear it manually. In addition, you can download the content of the visible map area by tapping the “Add current zone” button, or edit previously saved areas by selecting them from the list below.
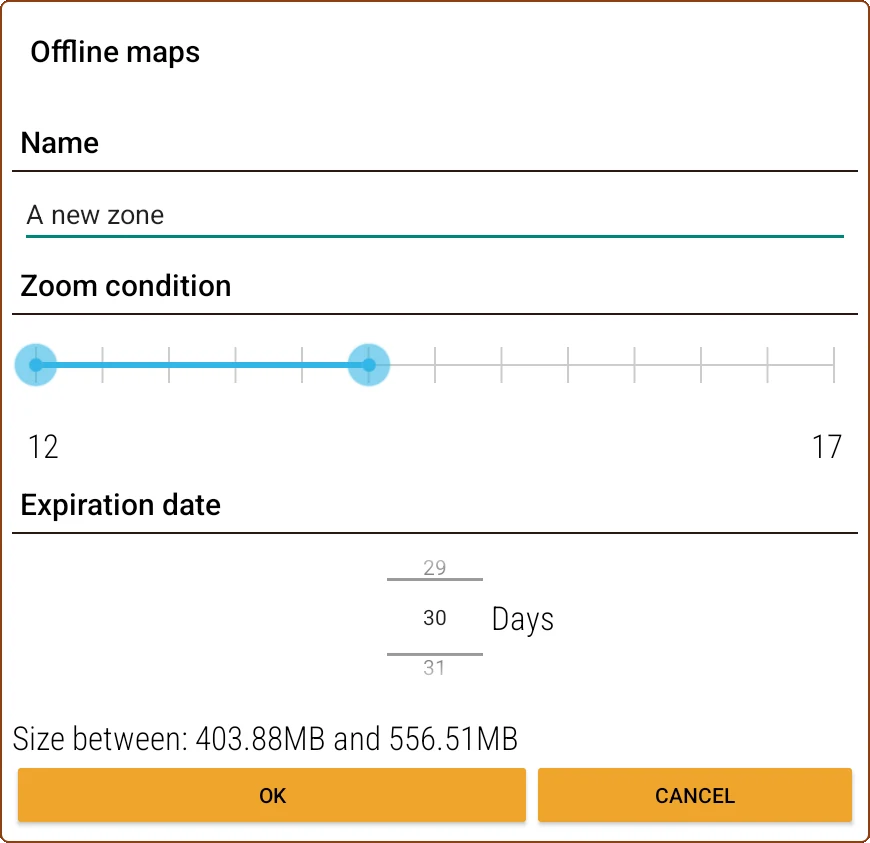
When editing a zone, you must assign a name, a range of zoom levels, and an expiration time (in days). The range starts from the current zoom level onward. Since each level takes up twice the space of the previous one, it is important to consider the estimated size needed for storage, which is shown at the bottom of the screen.
Once the settings are saved, upon returning to the map a background service will run and start the download. When the zone expires or is deleted, this service will also take care of clearing the corresponding cache from storage.
⚠️ Download zones before heading to the field, with plenty of free storage. If the device runs out of space during the download, the service does not always report it with a visible error: a zone can end up "downloaded" with missing tiles, which only shows up in the field as blank patches on the map with no signal to fill them in. Check the estimated size the screen shows against the device's free space before relying on a zone to work offline.
Filters
You can apply custom filters and sort orders to view and organize the data shown in the table browser and on the map. These filters are defined from the layer menu.
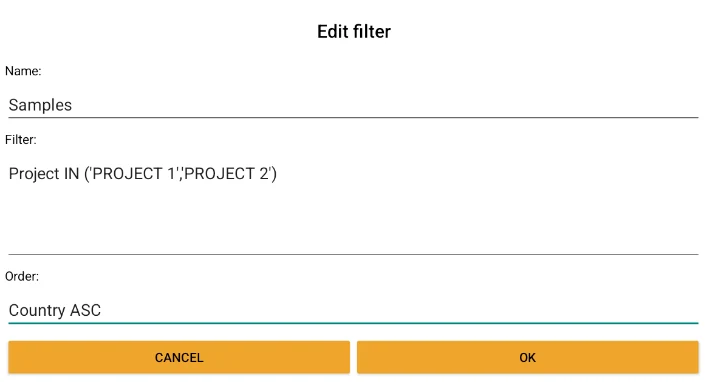
In the first field, you can assign a descriptive name to the filter.
In the “Filter” field, you can enter any expression valid in a WHERE clause of Spatialite. When this control gets focus, a pop-up will appear to assist you with creating these expressions. You can see a list of the engine's functions at https://www.gaia-gis.it/gaia-sins/spatialite-sql-5.1.0.html.
For example, to show several lithologies at once in the same layer, use SQL's IN clause: Lithology_Type IN ('QZP','GRD') shows only the intervals whose lithology is quartz porphyry or granodiorite.
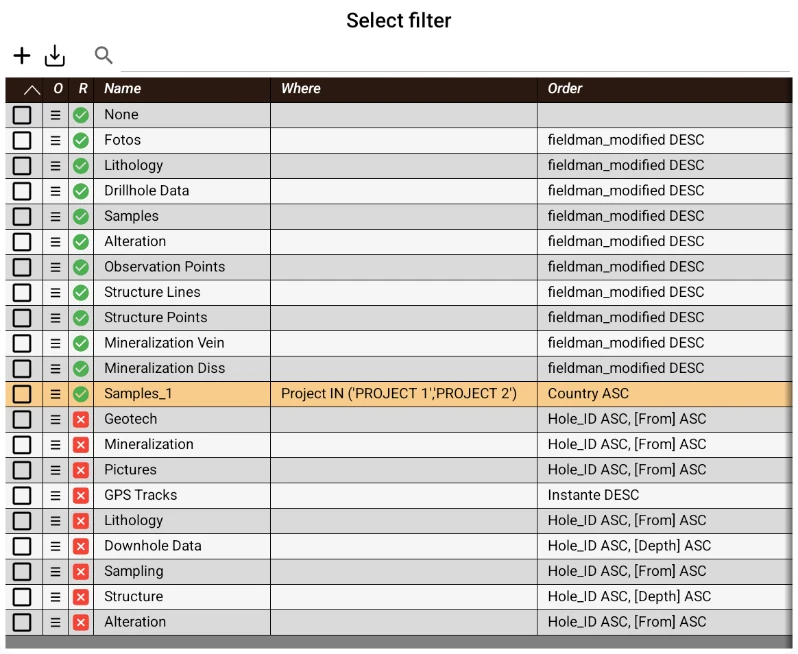
In the “Order” field, you can specify one or more ORDER BY clauses in SQL syntax, to define the sorting criterion for the tuples. This control also has a pop-up with assistance.
As a system resource, filters have their own manager, where you can search, create, delete, modify, import, and export filters in fmr format. The project also includes two base filters, already available to assign to any layer without needing to create them: “Filter All” (shows all tuples) and “Filter None” (shows none, useful for turning off a layer at the data level and leaving it only as a geometric reference on the map).
The element highlighted in color is the one currently selected in the current layer. Tap the description of another compatible one to assign it and close the window. 
Labels
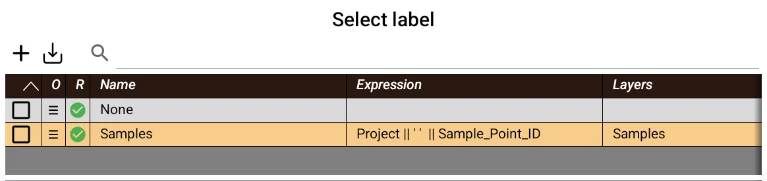
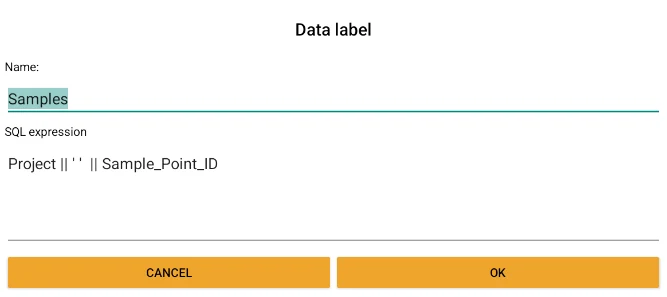
Labels are a project resource that defines the descriptive text of each tuple in a table, through an SQL expression (for example, concatenating the sample code with its lithology). The same label can be assigned to several layers, and it is used as the first column of the data browser, in the pop-up menus when tapping geometries on the map, and as the text of the labels drawn on the map.
From the layer menu, each layer's label button lets you Select a label through the label resource manager, and enable or disable it. That manager works the same as the filters one: from its top button bar you can search, create, delete, modify, import, and export labels in fmr format.
Data Browser
This control lets you browse a table's data and is located at the bottom of the map. If it is not visible, just drag the main button upward.
The first column of the browser shows the tuples' label, which can be configured from the Layer Menu, and corresponds to those shown on the map. In the header, the first column shows the table name, followed by the table's attributes.
Cells without a value (null) are shown as** in gray and italics, to distinguish them from empty texts.
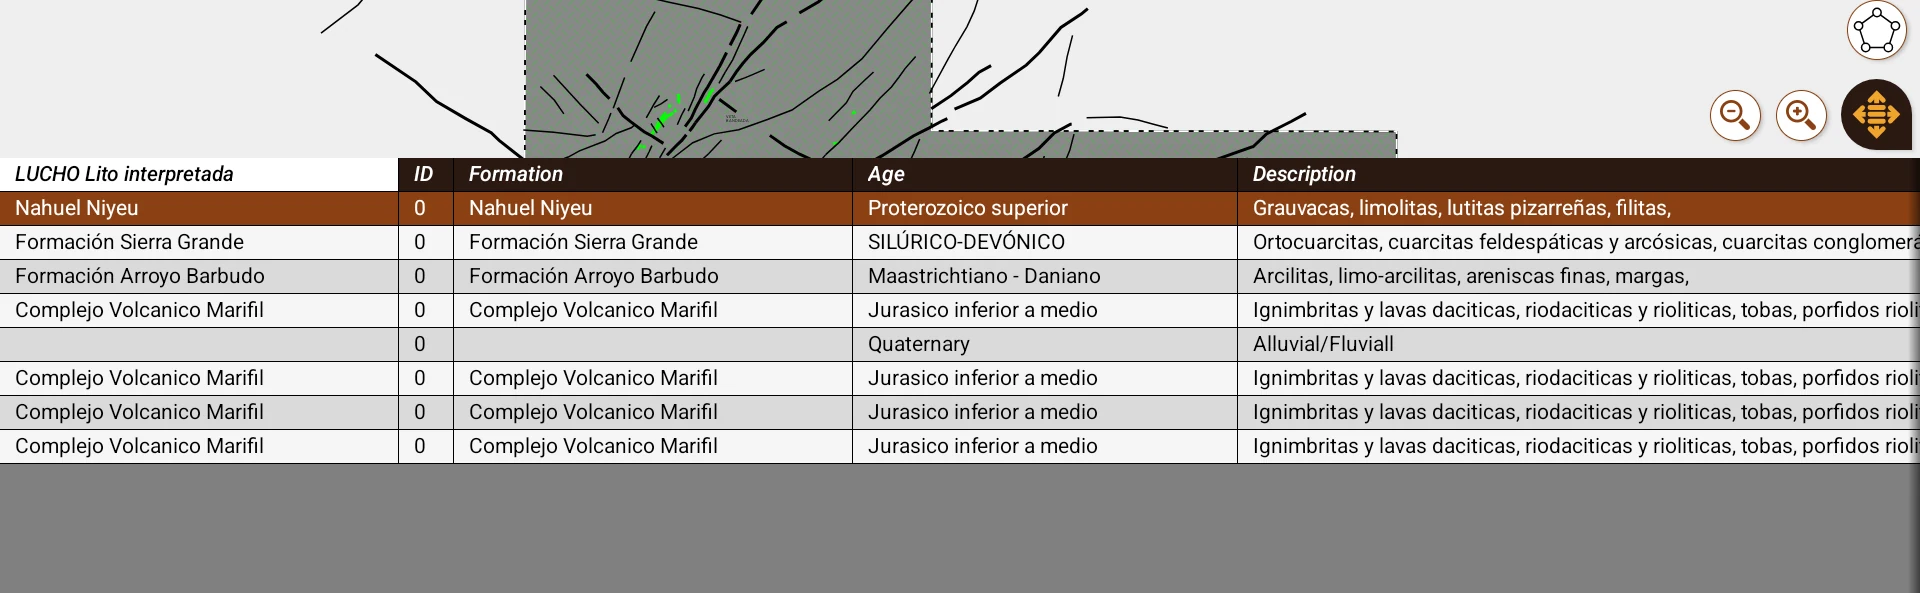
By dragging a finger or the pen over the content, you can scroll vertically or horizontally. Dragging over the headers lets you change the width of each column; in the case of the first header, you can also change the height of all rows.
When selecting a cell in the first column, if the tuple has an associated geometry, it will be centered on the map and highlighted. When tapping other columns of a row, a menu with applicable options will open, with the row's label as the title and, if it contains associated images or audios, a small interactive gallery will appear. Clicking on the images opens them in the device's default viewer; tapping an audio starts the built-in player. Holding a cell down (long touch) jumps straight to the geocoder for that field, skipping the menu — the same as tapping it and choosing "Edit attributes".
The preferences window has the "Open in Data Browser on select" option (independent for map and for core logging, see Preferences Window), with three values: don't open, scroll to the selection if it isn't visible (without switching tables; it only acts if the data browser is already showing the tapped layer), or open the tuple tapped on the map directly in the data browser.
Context menu options:
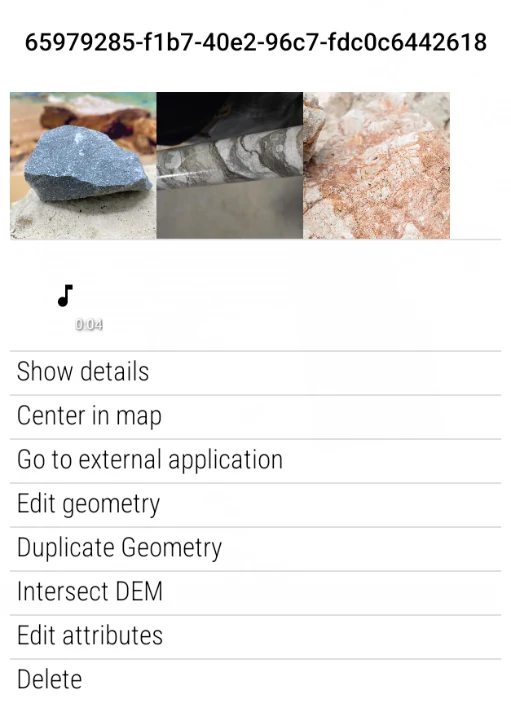
- Show details: Opens a window with the tuple's attributes. You can swipe sideways to see the previous or next tuple. Long text values are truncated to 10 lines; when this happens, a chevron arrow appears at the end of the value that rotates 180° when tapped, showing whether it's expanded or collapsed. Holding a value down (long touch, except for read-only ones) jumps straight to the geocoder for that field.
- Center on map: If there is an associated geometry, it centers the map on its location.
- Go to external application: Opens the location of the geometry's center in an external maps app (intent URI:"geo:0,0?q=y_centro,x_centro(descriptor)": Starts the editor to modify the associated geometry.
- Edit geometry: Starts the editor to modify the associated geometry.
- Duplicate Geometry: Copies the selected geometry into another table. You must first choose the target table in the layer menu (see Vector Layers). Then, the geocoder will open to enter the attributes. This is useful, for example, for mapping the lithology and alteration of the same outcrop in different layers.
- Intersect DEM (Only available when tapping points): Generates a tuple that includes the polyline obtained from the intersection between a plane and a DEM, after which the geocoder opens to fill in the corresponding attributes. For more details about this tool, see the chapter dedicated to the Geometry Editor.
- Edit attributes: Opens the geocoder to modify the tuple's fields. You go directly to the field corresponding to the tapped column, unless some validation prevents it.
- Delete: Deletes the tuple and its associated geometry from the database. This action can be undone from the Undo/Redo button at the bottom of the layer menu.
This menu can also be opened by tapping a geometry directly on the map (see Map).
You've read enough. Try it with your own project.
20 days free, with your data. If you get stuck: the manual — and us.
Secure payment with Stripe · Cancel anytime.