
How to log drill core on a tablet
The drill hole logging module: hole selector, graphical strip log, log track and chart, to log in the field without paper.
How to log drill core on a tablet
Core Logging
The core logging activity is designed to capture, visualize, and export the information obtained during core logging. Its interface combines a strip log with a data browser, allowing you to simultaneously describe multiple geological attributes: lithology, alteration, mineralization, structures, geotechnics, and sampling.
Data is organized into tables linked by the drillhole identifier (Hole ID) and the depth intervals (From / To). These fields are assigned when importing or creating a new table (see Import Data).
To open the activity, select "Core Logging" from the main menu with the desired project active.
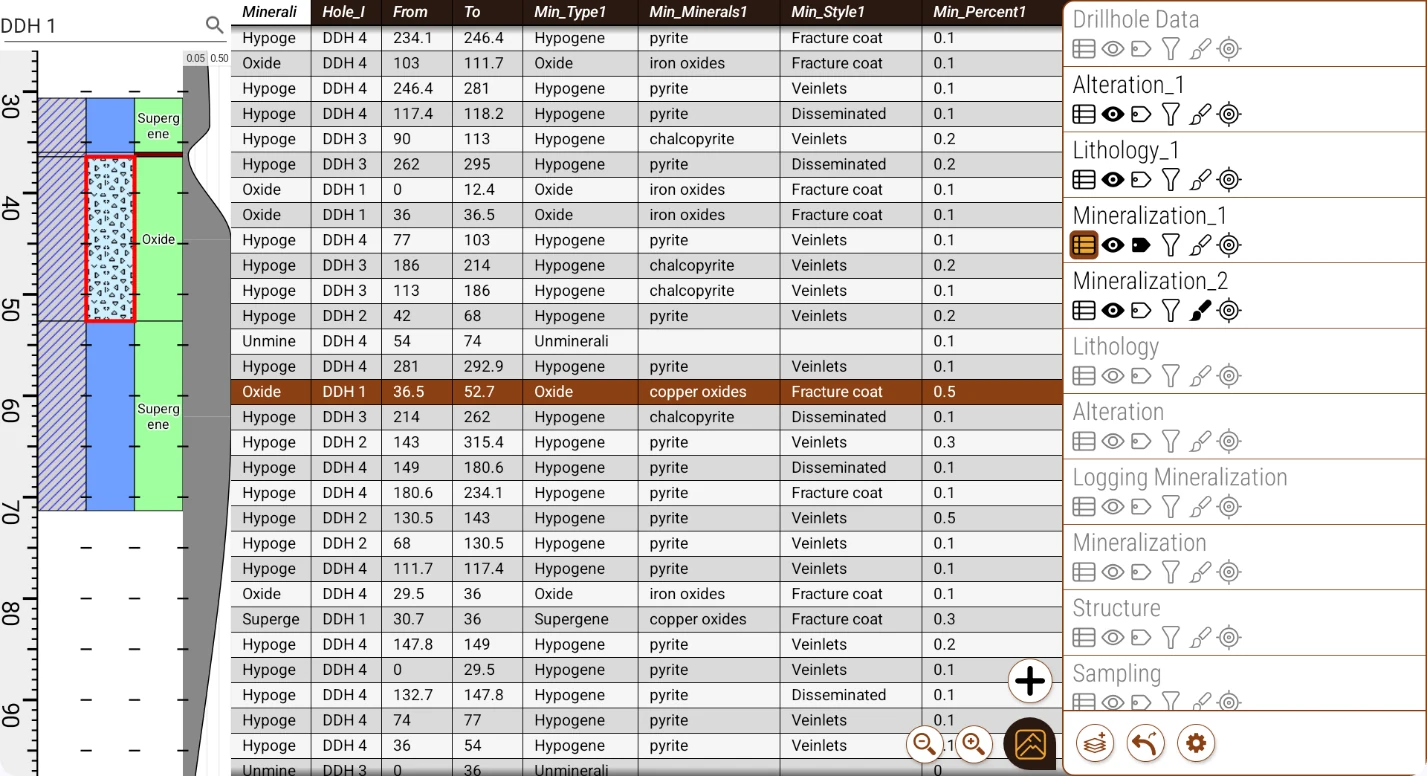
The screen includes: the strip log on the left, with the hole selector at the top; the data browser in the center; and the quick access bar on the right, next to the layer menu.
Main button
The main button is the circular floating control located on the right edge of the screen. It controls the layer menu and the display of the strip log:
- Drag to the left: opens the layer menu. A fling gesture can be used to open or close it at once. It can also be closed with the Back key.
- A tap: toggles between showing the name of each layer over the strip log and showing the depth scale. When the menu is open, the depth scale is shown; when it is closed, the layer names.
Hole selector
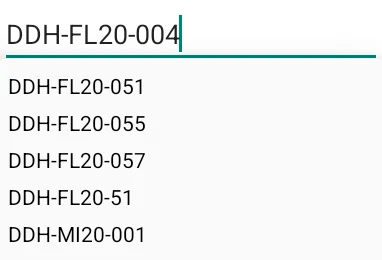
The hole selector is located at the top of the strip. It shows the name of the drillhole being displayed and lets you switch between all the drillholes available across all layers with a single tap.
Tapping it opens the list of all recorded drillholes, with a search field to filter them by name. Select one to draw it on the strip. A cross to the right of the field (next to the search icon) clears the selected drillhole.
Layer menu
The layer menu is shown or hidden by dragging the main button to the left. It lists all the layers of the activity and controls which columns are shown in the strip log and in what order.
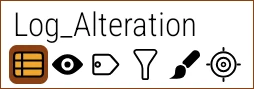
Each layer appears as a list item and references a project table. The layers located at the top of the list are drawn on the left side of the strip log. They can be reordered by holding down the layer name and dragging it to a new position.
Each item is composed of the layer name and a row of control icons:
 Table type: Tap once to select the table as the destination for new tuples: the icon will be highlighted. You may be asked to choose a geocoder (see Geocoders). Hold down to open the table in the data browser (repeat to close it).
 Show/hide: A tap toggles the visibility of the column in the strip log. Hold down to show only this layer in the strip log.
 Label: Shows or hides the interval labels in the strip log column. A tap toggles their visibility; if the layer does not yet have a label defined, it opens the selector to choose or create one (see Labels).
 Filter: Enables or disables the table's filter. If none is defined, the filter dialog will open. Hold down to edit the filter directly (see Filters).
 Log track: Lets you assign or modify log tracks. It sets how each strip is drawn (Interval, Symbol or Graph) (see Log track).
 Positioned GPS sampling: When active, creating a tuple in this layer -with the Sample button or with its button in the button bar- makes the application turn on the GPS and wait to obtain a position that meets the configured minimum precision, and it saves that coordinate along with the tuple. If inactive, the tuple is created immediately with the last known position. The required precision and continuous GPS operation are configured in the Preferences window (see Minimal capture precision required: and Keep GPS on during core logging).
Tapping the layer name opens a menu with the following options:
- Select geocoder: Lets you choose which geocoder will be used to log the data in the intrinsic table. (see Geocoders).
- Add/Remove from button bar: Adds or removes a quick access button for this layer, drawn above the add button (+). A short tap opens the geocoder to create a new tuple in the layer. If the layer has Positioned GPS sampling active
 , the current GPS position is also saved in the tuple.
 - Duplicate layer: Adds a copy of the layer to the map (same assigned filters, label, style, and geocoder) pointing to the same table. It does not duplicate the data or the table.
- Remove layer: Removes the layer from the map. This action does not delete the intrinsic table or its data, so you can add it again from the resource manager. (see Resource Manager).
- Rename layer: Changes the visible name without affecting the table name.
- Quick controls submenu: Gathers, in one place, the same controls as the icons below the layer title (show/hide, filter, label, dynamic style, show data).
- Move to group…: Opens a submenu to choose the target group, or create a new one with Move to new group…. If the layer already belongs to a group, Remove from group also appears, which leaves it loose.
Layer Groups
Layers can be organized into collapsible groups. To create a group, use Move to group… in the layer menu and choose Move to new group…: the group is created and the layer is placed inside it. To move a layer to an existing group, drag it below the header of an expanded group or use Move to group… / Remove from group.
Tapping a group's header opens its menu, with options to Rename group, Delete group (its layers are left loose) and Collapse/Expand. The arrow on the header collapses or expands the group without opening the menu.
The header shows the Show/hide and Filter buttons, which act on all layers in the group at once. Hold down Show/hide to show only this group.
Layer Memories
 Saves the state of the layers to reapply it when needed. The button is at the bottom of the layer menu, first in the row of buttons. There are up to nine memories (slots), numbered 1 to 9, separate from the map's.
To record a memory, hold down the button and choose 💾 Set memory, at the end of the menu. The app asks for an optional description and which properties to include, and saves the current state of all layers and groups in the active slot. The dialog is the same as on the map (see Layer Memories); in the log, Snap, Clickable and Transparency have no effect.
A short tap applies the active slot's memory; tapping the button again restores the previous state, so it works as a quick undo. The number shown on the button indicates the slot in use. If the active slot is empty, the short tap records it and the app confirms with "Memory N saved".
The nine slots are listed in that same menu (hold down the button), with a dot on those that have a saved memory. Choosing a slot with a memory makes it active and applies it right away; choosing an empty one only makes it active, ready to record. Memories are saved inside the project.
Strip log
The strip log is the central graphical view of the logging activity. Each layer visible in the layer menu that has a dynamic style configured will generate a column in the strip log, ordered the same way as in the layer menu.
On the left margin of the strip log a graduated depth ruler is shown, with major, intermediate, and minor marks accompanied by numeric labels. The divisions adjust automatically to the zoom level so they are always comfortable to read.
Vertical zoom: The +/- magnifier buttons at the bottom adjust the visible depth range. You can also zoom by holding down the screen while sliding up or down. Another way to zoom is to drag vertically over the depth ruler (the left margin), without needing to hold down the screen.
Scrolling: Slide over the strip log to move it up or down.
Column width: Drag horizontally over the strip log to make it wider or narrower (this affects all columns, which keep their relative width). To change the width of a single column, hold it down (it vibrates and highlights) and then drag horizontally: only that column changes width, the others stay fixed in pixels.
Tapping a section in the strip log highlights it with a colored border and opens the same context menu as in the data browser, including the “Show in data grid” option. The preferences window has the "Open in Data Browser on select" option (see Preferences Window), independent for core logging and for the map, with three values: Don't open; Scroll into view if hidden, which scrolls to the selection without switching tables; and Open in Data Browser, which opens that tuple directly in the data browser.
For a table to appear as a column in the strip log, three conditions must be met:
- The layer must be visible (eye icon active in the layer menu).
- The table must have a dynamic style configured that specifies the column to represent and the color scheme or pattern to use.
- The table must have intervals belonging to the selected drillhole.
The strip log updates automatically as new intervals are entered or styles are updated.
Log track
Lets you choose how each layer is drawn in the strip log. It is configured from the layer menu, which opens the Log track dialog, with the list of the project's log tracks and the option to create a new one.
When creating a log track you must choose its type:
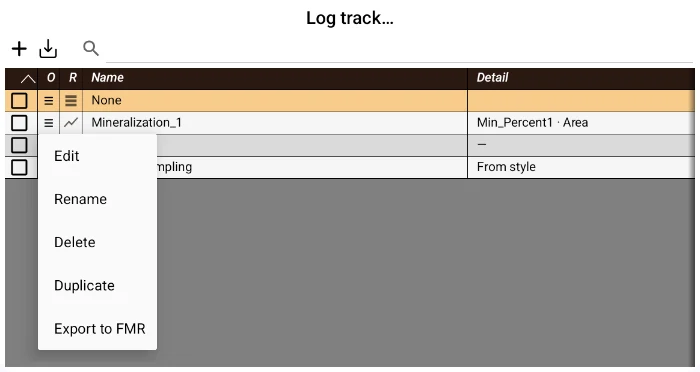
- Interval (boxes): for each interval it creates a box whose border and fill are defined by a polygon-type dynamic style. (see Dynamic Styles).
- Symbol: draws the symbol of the assigned point dynamic style, centred on each interval. (see Dynamic Styles).
- Graph: lets you plot a numeric attribute of the table.
Graph
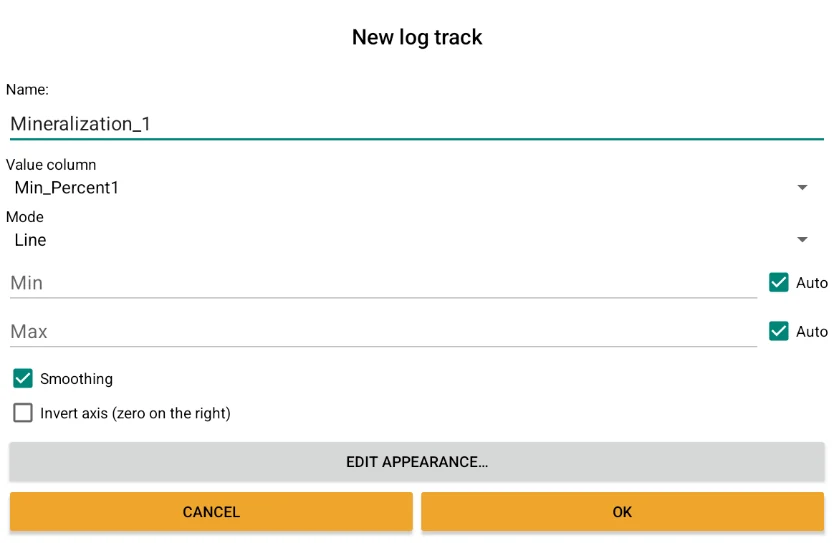
This type of log track lets you plot a value in a strip column.
It has 3 modes: bars, line and area; and they can be coloured with a dynamic style. Its parameters are:
Value column: select the table attribute you want to plot.
Mode: horizontal bars as tall as the interval and as wide as the value, a line chart with the values on the x axis, or a filled line chart. For the last two you can choose a dynamic style that affects how the graph looks in each interval.
Min and Max: you can enter a custom value for each one or tick Auto, and the application will query them directly from the table.
Smoothing: smooths the graph curve.
Invert axis: when this option is enabled, the graph has its origin on the right edge instead of the left.
If an imported drill hole table isn't drawn on the strip, see Troubleshooting: the usual causes are a layer with no dynamic style assigned, and the From and To columns imported as text instead of numbers.
You've read enough. Try it with your own project.
20 days free, with your data. If you get stuck: the manual — and us.
Secure payment with Stripe · Cancel anytime.